Logging
Let’s take a minute to talk about logging in SmartApps and Device Handlers.
There is an instance of a logger (log) injected into each SmartApp/Device Handler and available
for you use. Currently, we do not support a debugger environment for stepping through
code. Logging however works to this end in enabling you to log
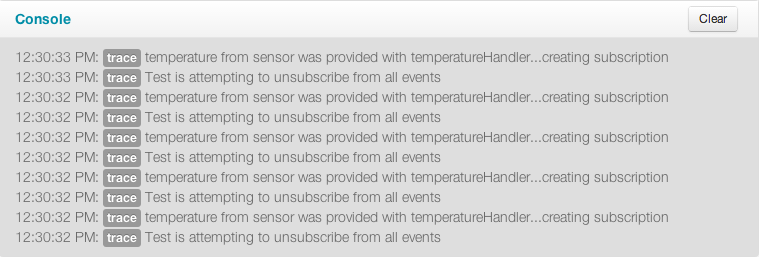
messages to the console in the IDE. When you save your code, and start
the simulation, a console panel will appear at the bottom of the IDE. This
is where the log messages from your SmartApp/Device Handler will appear.
Note
The ‘Clear’ button will clear all of the messages currently in the console.
Logging Levels
The log instance currently supports these log levels, in decreasing order of severity:
| Level | Usage | Description |
|---|---|---|
| ERROR | log.error(string) |
Runtime errors or unexpected conditions.
|
| WARN | log.warn(string) |
Runtime situations that are unexpected, but not wrong.
Can also be used to log use of deprecated APIs.
|
| INFO | log.info(string) |
Interesting runtime events. For example, turning a switch on or off.
|
| DEBUG | log.debug(string) |
Detailed information about the flow of the SmartApp.
|
| TRACE | log.trace(string) |
Most detailed information.
|
Logging Examples
Consider the following simple SmartApp which sets up some switch devices and has an event handler method that will log how many switches are currently turned on.
preferences {
    section {
        input "switches", "capability.switch", multiple: true
    }
}

def installed() {
    log.debug "Installed with settings: ${settings}"
    initialize()
}

def updated() {
    log.debug "Updated with settings: ${settings}"
    unsubscribe()
    initialize()
}

def initialize() {
    subscribe(switches, "switch", someEventHandler)
}

def someEventHandler(evt) {
    // returns a list of the values for all switches
    def currSwitches = switches.currentSwitch

    def onSwitches = currSwitches.findAll { switchVal ->
        switchVal == "on" ? true : false
    }

    log.debug "${onSwitches.size()} out of ${switches.size()} switches are on"
}
Let’s start the above SmartApp execution in the IDE. The first thing that we can see are messages like this:
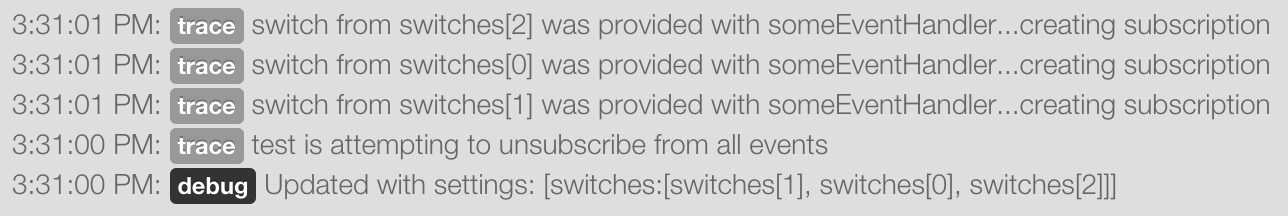
It is easy to see that the debug message came from the updated() method
def updated() {
    log.debug "Updated with settings: ${settings}"
But where did the other trace messages come from? These messages are coming
from the SmartApp framework. The SmartApp framework automatically will provide
certain information like this during the execution of a SmartApp. Try turning
one of the switches on in the IDE. You will see some more of these trace messages
coming from the SmartApp framework.
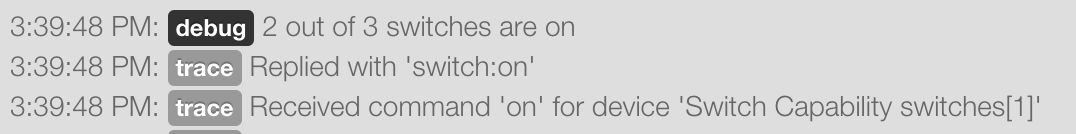
You will also see the debug message in the someEventHandler() method.
log.debug "${onSwitches.size()} out of ${switches.size()} switches are on"
You should expect to see something like this in the console.
Note
The newest messages appear at the top of the console output. Not the bottom.
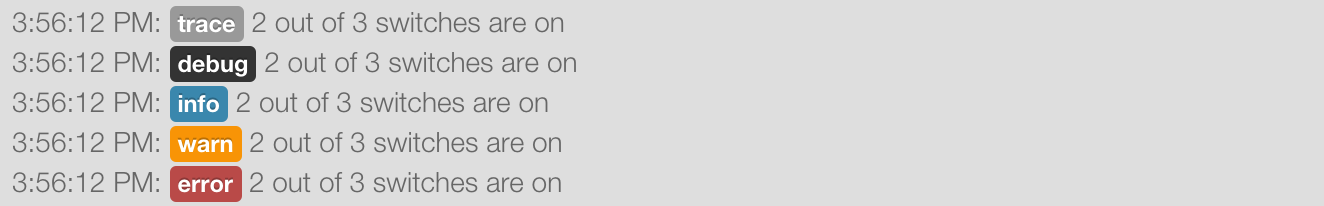
Lets see an example of how each one of the log levels look when output
to the console. In the someEventHandler() method, I’ve added the following
log messages for this example.
log.error "${onSwitches.size()} out of ${switches.size()} switches are on"
log.warn "${onSwitches.size()} out of ${switches.size()} switches are on"
log.info "${onSwitches.size()} out of ${switches.size()} switches are on"
log.debug "${onSwitches.size()} out of ${switches.size()} switches are on"
log.trace "${onSwitches.size()} out of ${switches.size()} switches are on"
The output is nice and color coordinated so we can visually see the severity of the various levels.
Finally, an example of how the logger can be used in a try/catch block instead of getting the exception.
try {
    def x = "some string"
    x.somethingThatDoesNotExist
} catch (all) {
    log.error "Something went horribly wrong!\n${all}"
}
